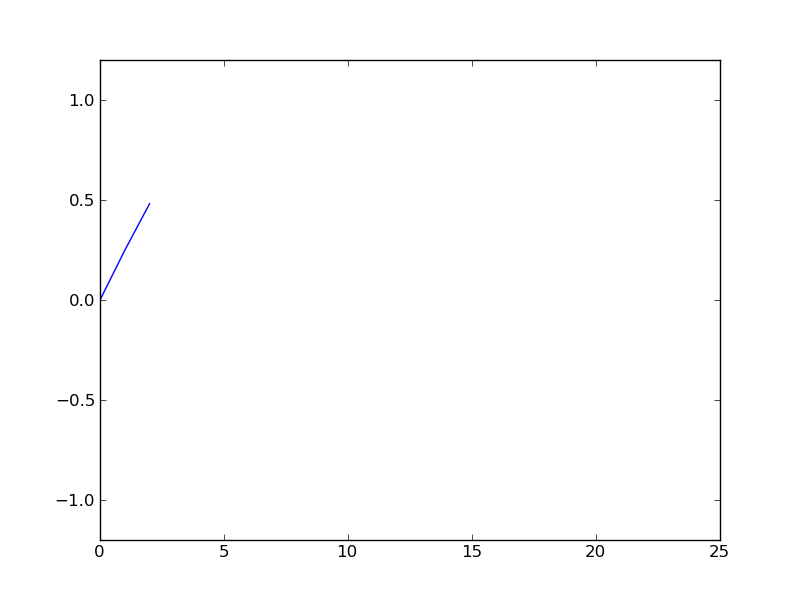
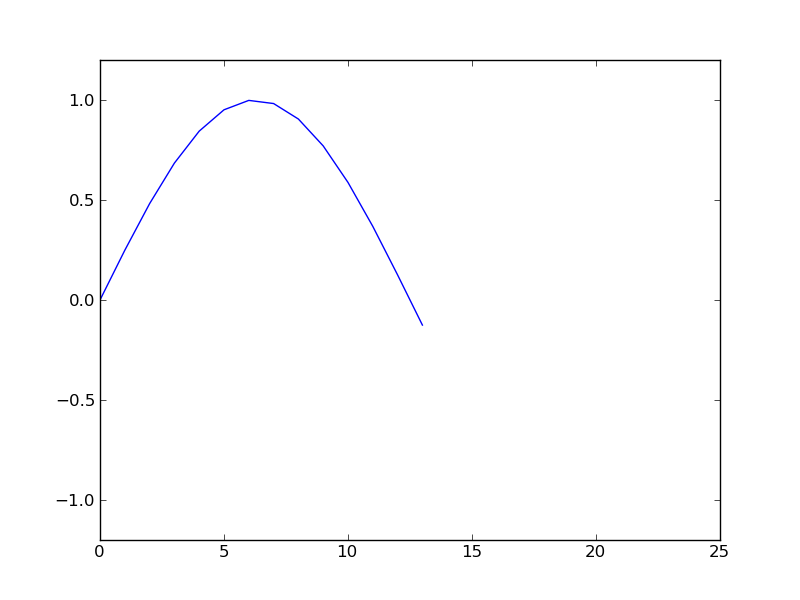
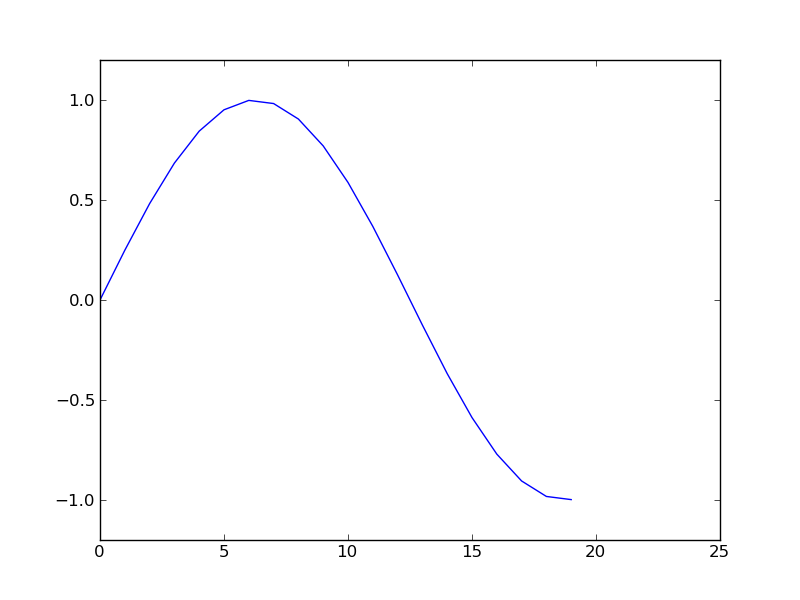
Slideshow
Download slideshow.py.
"""
Test demonstration for creating a single slideshow.
"""

import os
import math
import matplotlib.pyplot as plt
import mdp

n_frames = 25
path = "animation"
try:
    os.makedirs(path)
except Exception:
    pass

# create the animation images
filenames = []
section_ids = []
points = []
for i in range(n_frames):
    points.append((i, math.sin(1.0*i/n_frames * 2*math.pi)))
    if i <= n_frames/2:
        section_ids.append("positive")
    else:
        section_ids.append("negative")
    plt.figure()
    plt.plot(*zip(*points))
    plt.ylim(-1.2, 1.2)
    plt.xlim(0, n_frames)
    filename = "img%04d.png" % i
    plt.savefig(filename = os.path.join(path, filename))
    filenames.append(filename)

# cretate the slideshow
mdp.utils.show_image_slideshow(filenames=filenames, title="Test Animation",
                               image_size=(400,300),
                               filename=os.path.join(path, "animation.html"),
                               section_ids=section_ids)


Live Demo is available.
Double slideshow
Download slideshow_double.py.
"""
Test demonstration for creating two slideshows in a single file.
"""

import os
import webbrowser
import math
import matplotlib.pyplot as plt
import mdp

n_frames = 25
path = "animation"
try:
    os.makedirs(path)
except Exception:
    pass

# create the animation images
filenames1 = []
filenames2 = []
section_ids1 = []
section_ids2 = []
points1 = []
points2 = []
for i in range(n_frames):
    # first animation
    points1.append((i, math.sin(1.0*i/n_frames * 2*math.pi)))
    if i <= n_frames/2:
        section_ids1.append("positive")
    else:
        section_ids1.append("negative")
    plt.figure()
    plt.plot(*zip(*points1))
    plt.ylim(-1.2, 1.2)
    plt.xlim(0, n_frames)
    filename = "img_1_%04d.png" % i
    plt.savefig(filename = os.path.join(path, filename))
    filenames1.append(filename)
    # second animation
    points2.append((i, math.cos(1.0*i/n_frames * 2*math.pi)))
    section_ids2.append("%d" % i)
    plt.figure()
    plt.plot(*zip(*points2))
    plt.ylim(-1.2, 1.2)
    plt.xlim(0, n_frames)
    filename = "img_2_%04d.png" % i
    plt.savefig(filename = os.path.join(path, filename))
    filenames2.append(filename)

# create the slideshow
filename = os.path.join(path, "animation.html")
html_file = open(filename, 'w')
html_file.write('<html>\n<head>\n<title>%s</title>\n' % "Two Animation Test")
html_file.write('<style type="text/css" media="screen">')
html_file.write(mdp.utils.basic_css())
html_file.write(mdp.utils.image_slideshow_css())
html_file.write('</style>\n</head>\n<body>\n')
html_file.write(mdp.utils.image_slideshow(
                                image_size=(400,300),
                                filenames=filenames1, title="Animation 1",
                                section_ids=section_ids1))
html_file.write(mdp.utils.image_slideshow(
                                image_size=(400,300),
                                filenames=filenames2, title="Animation 2",
                                shortcuts=False, section_ids=section_ids2))
html_file.write('</body>\n</html>')
html_file.close()
webbrowser.open(os.path.abspath(filename))
print "done."
